How are satellites used to observe the ocean?
Satellites can "see the sea" in ways that are otherwise impossible.

The Geostationary Operational Environmental Satellite-16 (GOES-16) is the first of NOAA's next generation of geostationary weather satellites. Among the many missions of this satellite, it will collect ocean and climate data.
Satellites are amazing tools for observing the Earth and the big blue ocean that covers more than 70 percent of our planet. By remotely sensing from their orbits high above the Earth, satellites provide us much more information than would be possible to obtain solely from the surface.
Using satellites, NOAA researchers closely study the ocean. Information gathered by satellites can tell us about ocean bathymetry, sea surface temperature, ocean color, coral reefs, and sea and lake ice. Scientists also use data collection systems on satellites to relay signals from transmitters on the ground to researchers in the field—used in applications such as measuring tidal heights and the migration of whales. Transmitters on satellites also relay position information from emergency beacons to help save lives when people are in distress on boats, airplanes, or in remote areas. Here are just a few of the many ways satellites help us learn more about our ocean:
Sea Surface Temperatures

A simulation of sea-surface temperatures from the Geophysical Fluid Dynamics Laboratory.
Knowing the temperature of the sea surface can tell scientists a lot about what's happening in and around the ocean. Temperature changes influence the behavior of fish, can cause the bleaching of corals, and affect weather along the coast. Satellite images of sea surface temperature also show patterns of water circulation. Examples include locations of upwelling, characterized by cold waters that rise up from the depths, often near the coasts; and warm water currents, such as the Gulf Stream. The most commonly used instrument to collect sea surface temperatures is the Visible Infrared Imaging Radiometer Suite (VIIRS) instrument aboard the NOAA/NASA Suomi NPP satellite. This sensor captures new data every day, allowing scientists to piece together series of maps that show sea surface temperature variations over time for different regions around the globe.
Sea Surface Color
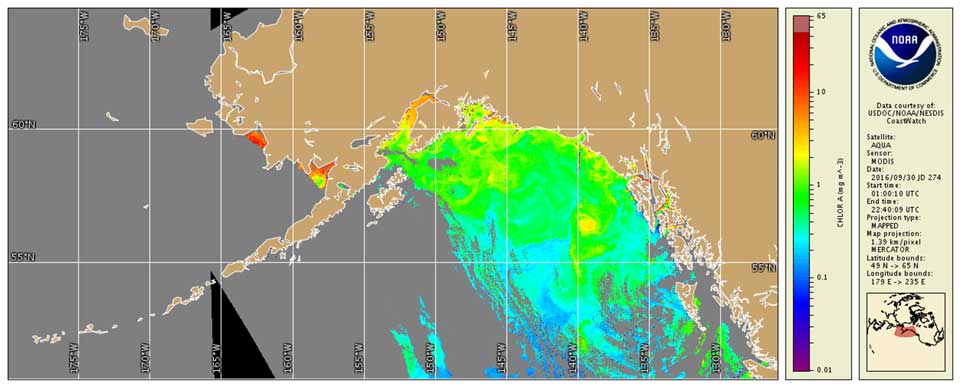
Satellites also provide information about the color of the ocean. For example, color data helps researchers determine the impact of floods along the coast, detect river plumes, and locate blooms of harmful algae that can contaminate shellfish and kill other fish and marine mammals. Ocean color data from satellites allows us not only to identify where an algal bloom is forming, but also to predict where it might drift in the future. Treatment plants also use algal bloom forecasts created by NOAA to decide when to change their water treatment formula to handle the algae.
Sea Level Change
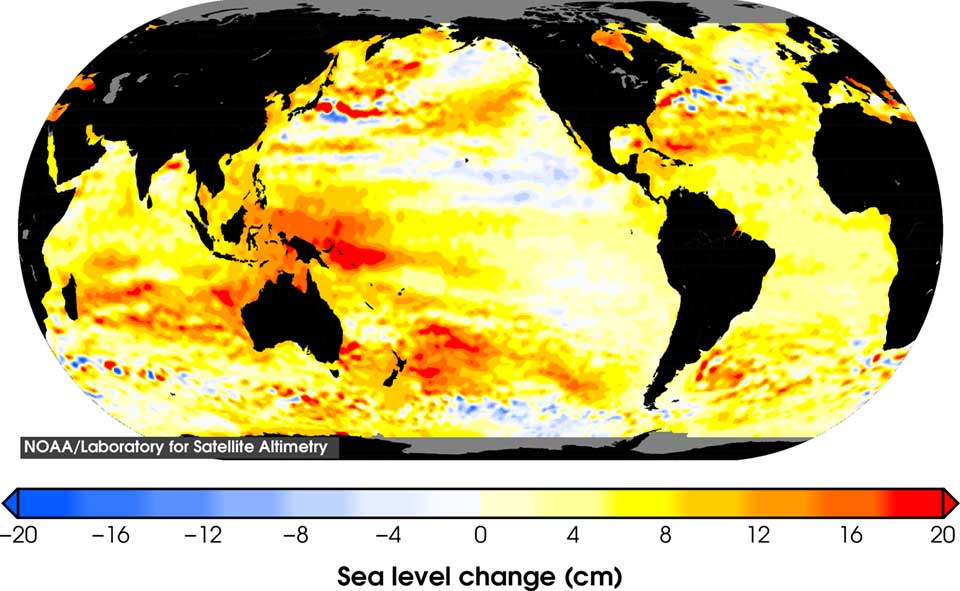
A map of total sea level change since 1993.
One of the most significant potential impacts of climate change is sea level rise, which can cause inundation of coastal areas and islands, shoreline erosion, and destruction of important ecosystems such as wetlands and mangroves. Satellite altimeter radar measurements can be combined with precisely known spacecraft orbits to measure sea level on a global basis with unprecedented accuracy. The measurement of long-term changes in global mean sea level provides a way to test climate models' predictions of global warming.
Mapping
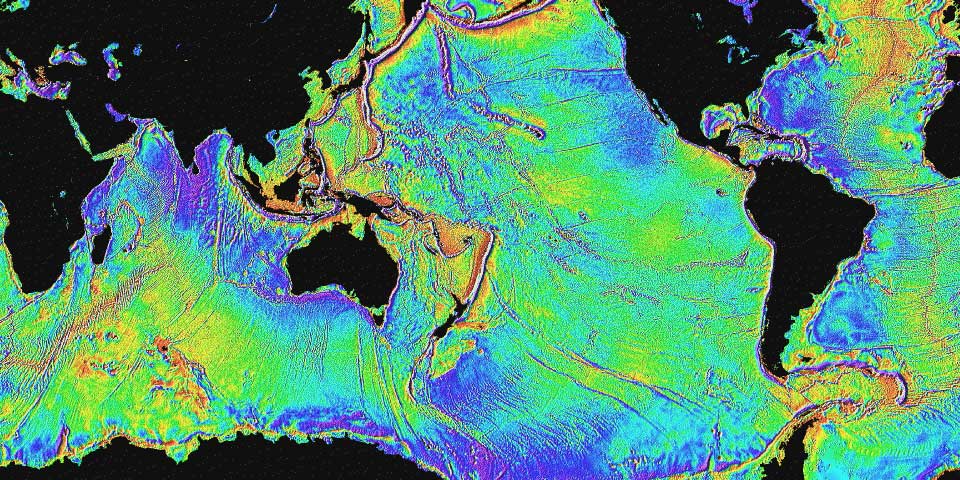
The surface of the ocean bulges outward and inward, mimicking the topography of the ocean floor. The bumps, too small to be seen, can be measured by a radar altimeter aboard a satellite.
Satellite imagery may also be used to map features in the water, such as coral reefs. Sea floor geology is far simpler than the geology of the continents because erosion rates are lower, and also because the continents have suffered multiple collisions associated with the opening and closing of ocean basins. Despite its relative youth and geologic simplicity, most of this deep seafloor has remained poorly understood because it is masked by the ocean. To date, ships have charted only a small fraction of the seafloor. But thanks to gravity, the ocean surface has broad bumps and dips that mimic the topography of the ocean floor. These bumps and dips can be mapped using a very accurate radar altimeter mounted on a satellite.
Weather
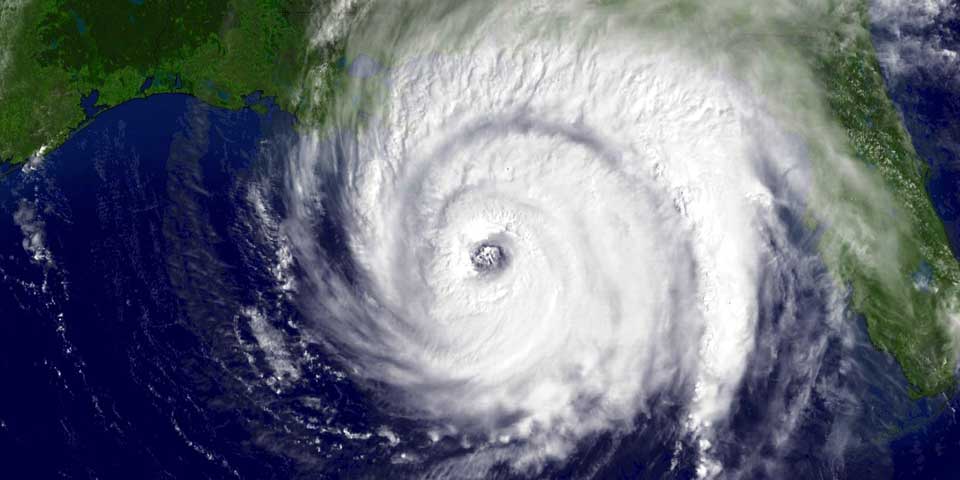
Hurricane Ivan on September 15, 2004, before it slammed into the U.S. Gulf Coast.
The ocean plays a major role in regulating the planet's weather and climate. Weather data is perhaps the most well known application of satellite technology. NOAA's operational weather satellite system is composed of two types of satellites: geostationary operational environmental satellites (GOES) for short-range forecasts, warnings, and observations; and polar-orbiting satellites for longer-term forecasting. Both types of satellite are necessary to provide a complete global weather-monitoring system.
Tracking
NOAA Fisheries scientists maneuver a tagged sea turtle toward the end of the boat ramp.
Satellites providing environmental imagery may also be used jointly with other organizations that receive data from various sensors. For example, marine animals, such as sea turtles and manatees, can be fitted with transmitters that relay information about their locations to orbiting satellites. Similar technology is also used for human search and rescue.
Search Our Facts
Get Social
More Information
Did you know?
The Geostationary Operational Environmental Satellite-16 (GOES-16) is the first in a series of NOAA's next generation of geostationary weather satellites. This satellite series will provide continuous imagery and atmospheric measurements of Earth's Western Hemisphere, total lightning data, and space weather monitoring to provide critical atmospheric, hydrologic, oceanic, climatic, solar, and space data.

Last updated: 06/16/24
Author: NOAA
How to cite this article