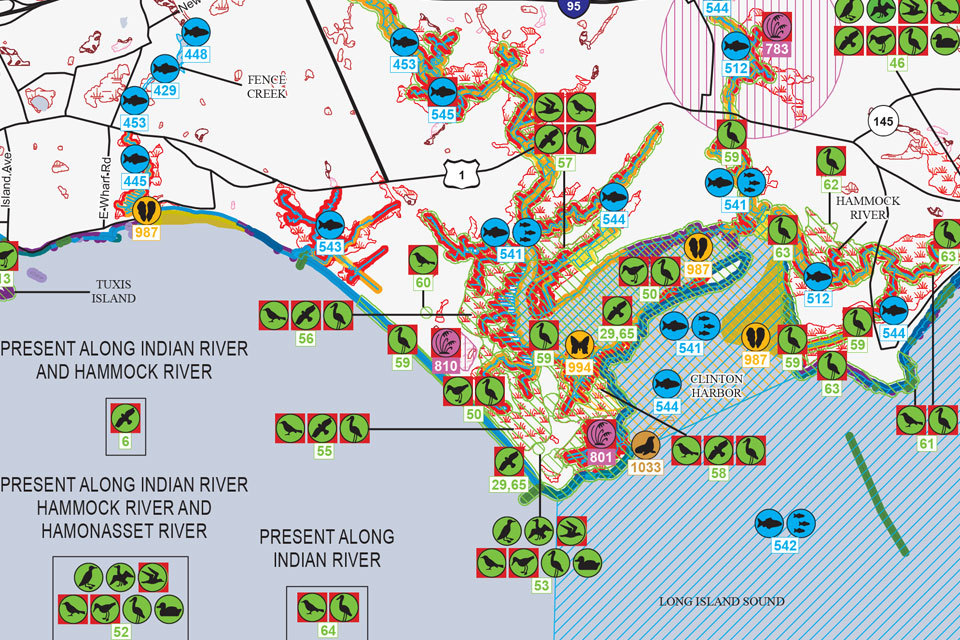
What is an environmental sensitivity index map?
An environmental sensitivity index map provides a concise summary of coastal resources that could be at risk in the event of an oil spill.

The symbols on an ESI map are color coded and prioritized for clean up by how sensitive they are to oil.
Environmental sensitivity index (ESI) maps are a compilation of information about coastal shoreline sensitivity, biological resources, and human resources. This information is used in planning to create cleanup strategies before an accident occurs so that authorities are prepared to take action in the event of such a spill. Advance planning reduces the harmful consequences of oil spills and cleanup.
ESI maps have many features that make them great tools for spill response teams. The maps are created using geographic information system (GIS) techniques in order to present regional maps with data on biological and human resources in an area, as well as information on sensitive shorelines. The shoreline resources are ranked and color-coded based on their sensitivity to oiling. The data on biological and human resources also use standardized colors and symbols. Organizations can use the synthesized data to create efficient and effective cleanup strategies. In addition to the maps, the ESI data are available in several digital formats for use within a GIS.
Researchers in the Office of Response and Restoration work with state, federal, and industrial agencies to create ESI maps.
Social