El Niño Made a Nuisance of Itself in 2015—Caused Tidal Flooding in Many U.S. Cities
Cities experienced record setting "nuisance flooding" due to El Niño from May 2015-April 2016.

Record Year
A new report, 2015 State of U.S. Nuisance Tidal Flooding, highlights nuisance flooding during the 2015 meteorological year and compares it to the outlook at 28 NOAA tide stations around the United States, which have collected data for more than 50 years. It also provides a new outlook for the 2016 meteorological year, taking into account the La Niña conditions anticipated to develop in the coming months. La Niña typically has less effect on tidal flood frequencies compared to El Niño, however the nuisance flooding trend is still increasing. Shown here: nuisance flooding along the Potomac River waterfront in Alexandria, Virginia.
The frequency of nuisance tidal flooding in many U.S. cities increased as predicted for the 2015 meteorological year, according to a NOAA report released on June 8, 2016.
In some cities, the days of nuisance flooding exceeded trends and broke records, especially in the southeastern U.S and Gulf Coast, which may be due to a strong El Niño compounding already rising sea levels.
Wilmington, North Carolina, saw an all-time high of 90 days of nuisance flooding, nearly one quarter of the year. Other cities with record numbers of flooding days are Charleston, South Carolina; Port Isabel, Texas; and Mayport, Virginia Key, Key West, and Fernandina Beach, Florida, the report said. Some cities in the Mid-Atlantic and West Coast also experienced greater tidal flooding frequencies above normal trends, including Norfolk, Virginia; Baltimore, Maryland; and San Francisco and La Jolla, California.
Nuisance flooding, which causes such public inconveniences as frequent road closures, overwhelmed storm drains, and compromised infrastructure, now occurs with high tides in many locations due to climate-related sea level rise, land subsidence, and the loss of natural barriers.
The outlook for 2016 shows that the cities with the highest frequency of nuisance flooding will likely be:
- Annapolis, Maryland with 47 days
- Wilmington, North Carolina with 42 days
- Washington, D.C. with 30 days
- Charleston, South Carolina with 27 days
- Atlantic City and Sandy Hook, New Jersey with 26 days
Along the California coast, less than 10 days are expected at La Jolla and San Francisco, a decrease from 13 and 20 days observed in 2015, respectively.
These findings are a continuation of annual nuisance flooding monitoring and experimental predictions led by NOAA scientists William Sweet, Ph.D., and John Marra, Ph.D. The 2015 outlook, beginning in May 2015 through April 2016, showed that mid-Atlantic and West Coast communities may experience an increase over the trend in the number of nuisance flooding days is likely due to higher sea levels during El Niño, which increases the reach of storm surges and high tides.
Nuisance flooding is increasing along U.S. coasts due to sea level rise. The extent of nuisance flooding depends on multiple factors, including topography and land cover. The study defines nuisance flooding as a daily rise in water level above minor flooding thresholds set locally by NOAA weather forecasters and emergency managers for coastal areas prone to flooding.
Get Social
More Information
Nuisance Flooding Chart
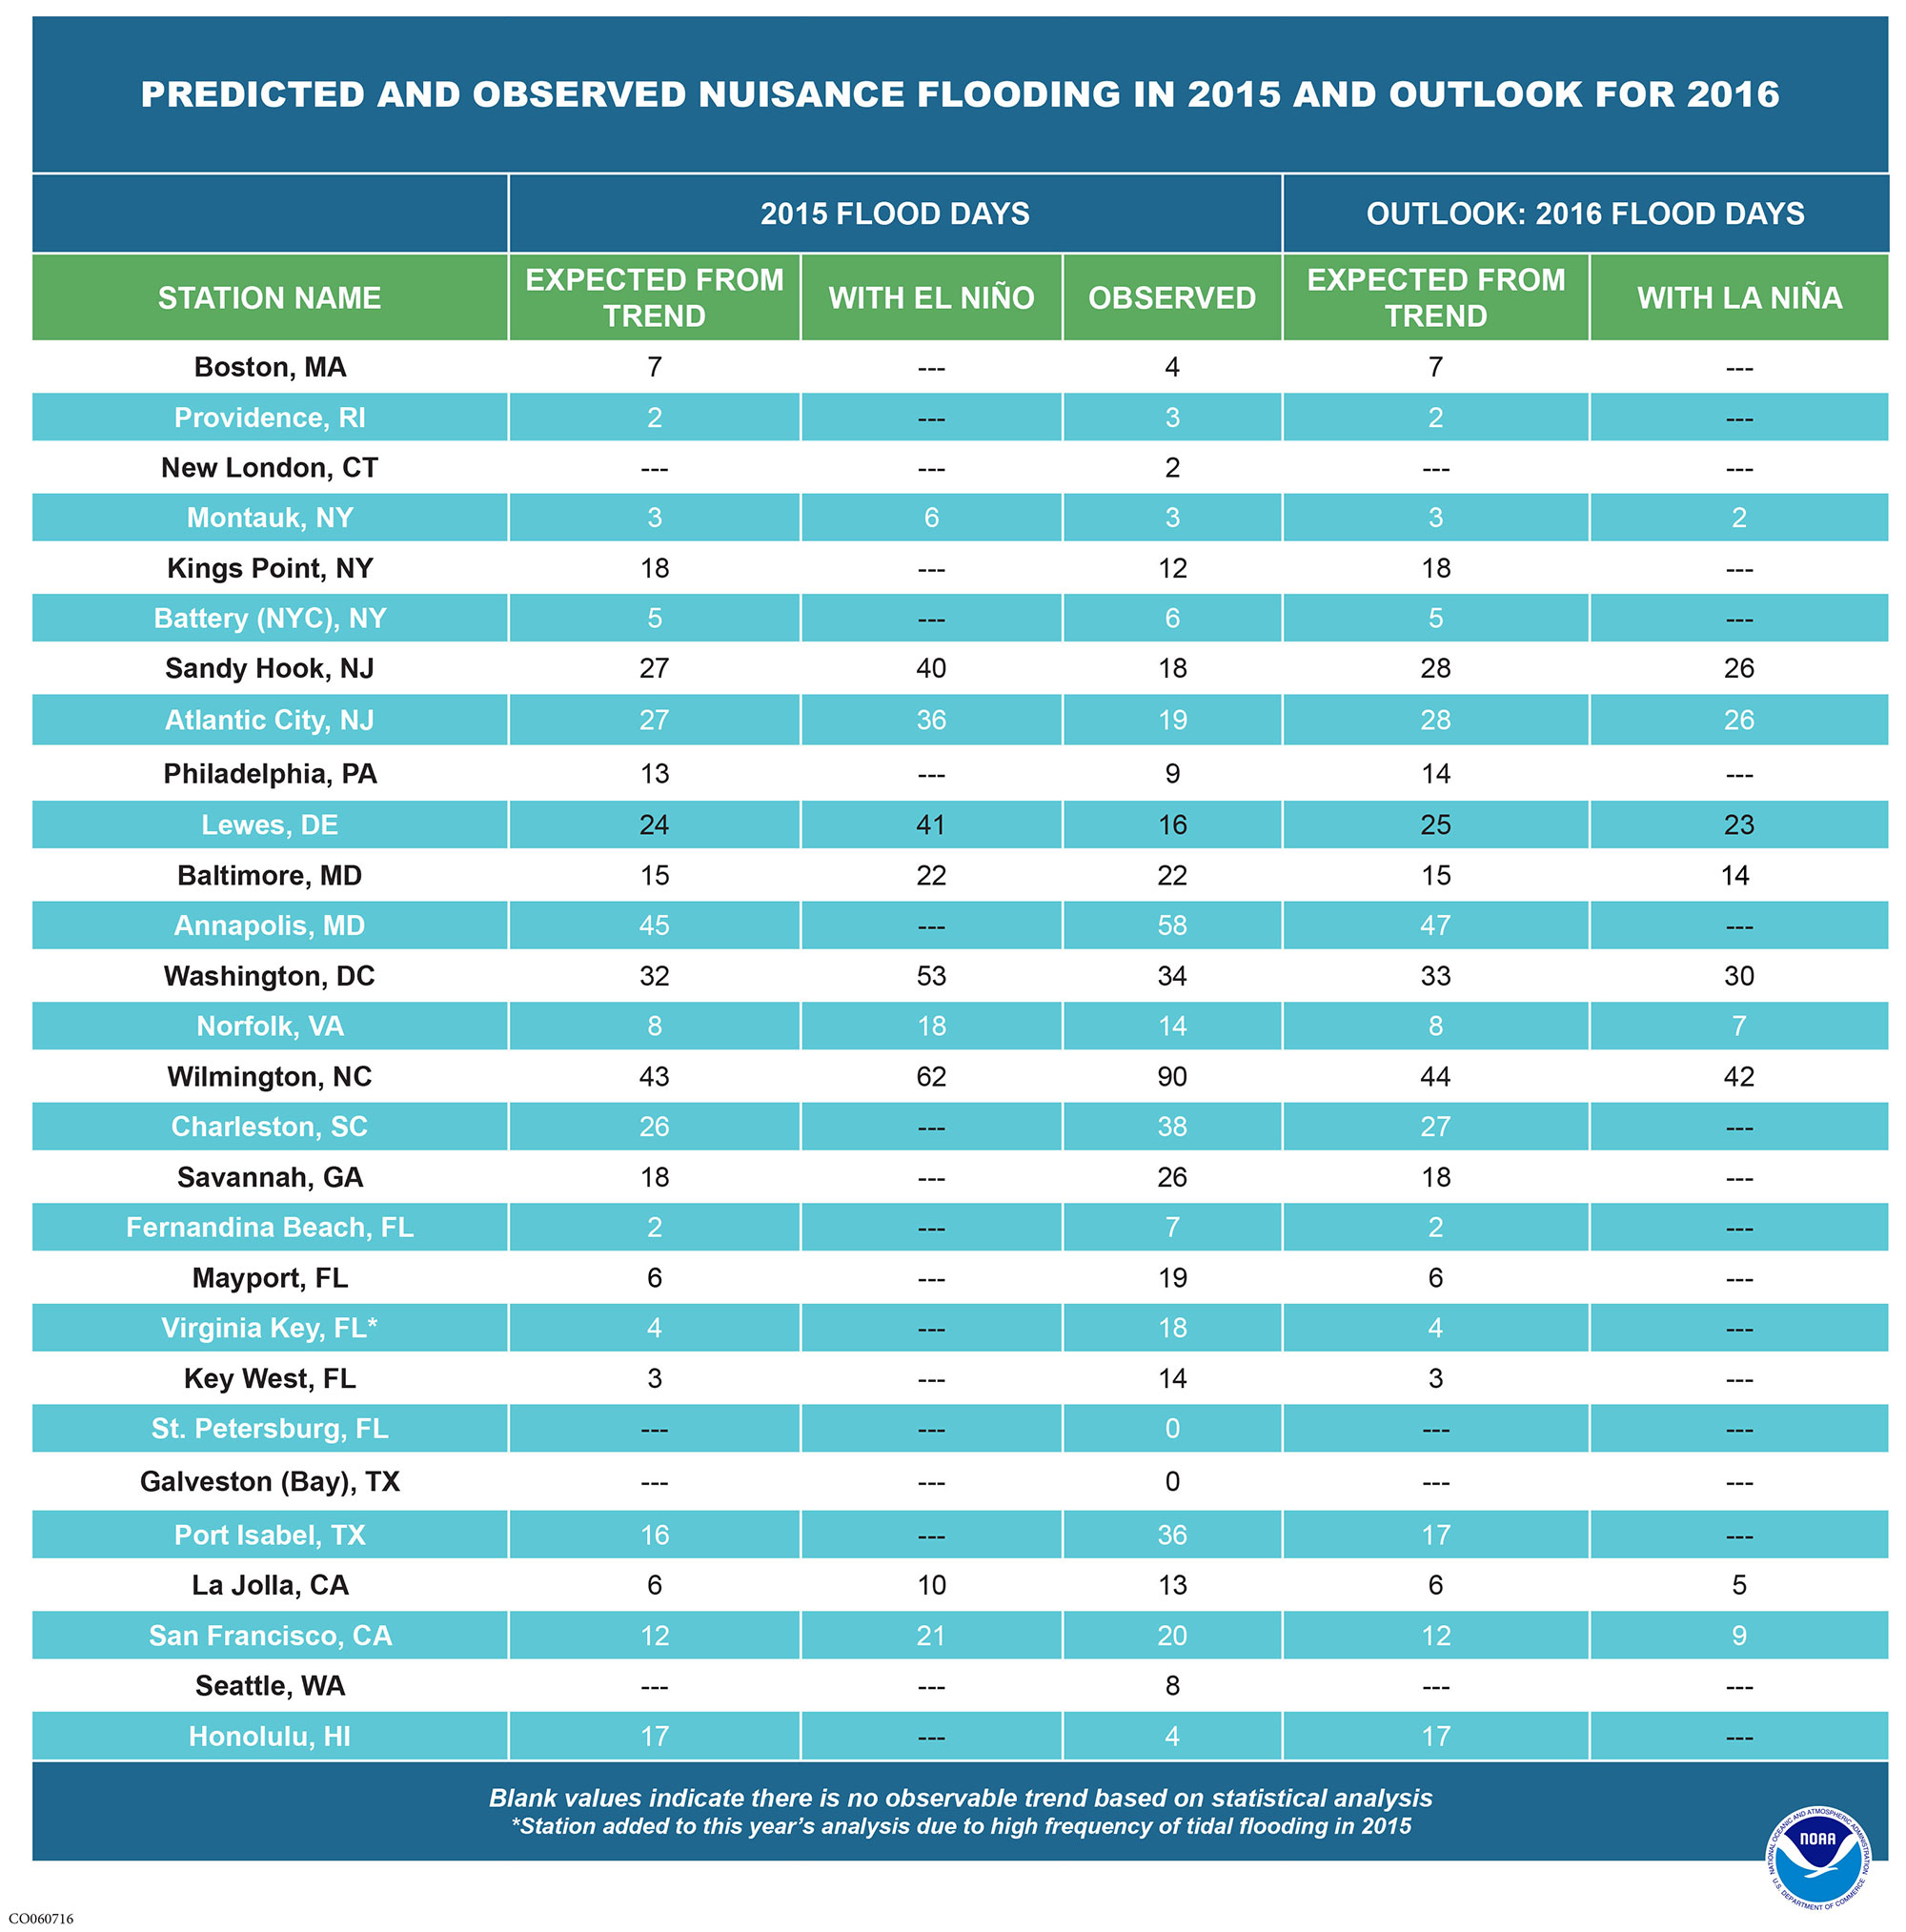
This table shows communities in the U.S. that saw an increase in nuisance flooding due to El Niño. Click or tap for a larger view. | Download (PDF)
